Dashboards and reports your board can read.
Design your own dashboards, describe them to AI or connect Power BI, all on the same governed GRC data.
CAPABILITIES
Build it, generate it or connect it.
Analytics Designer
Design reports with 18 visual types, from KPI cards and risk matrices to gauges, treemaps and geo maps, with filters, slicers and calculated fields.
AI Designer
Describe the dashboard you need and AI builds the layout for you in seconds.
Power BI connection
Admins generate an API key and Power BI reads the datasets your organization chose to release.
Run and export
Open any report in read-only mode to run it, and export it to PDF straight from the browser.
Every visual your board expects.
18 visual types, from KPI cards and risk matrices to gauges, treemaps, radar charts and geo maps, so each audience gets the right view of risks, controls, incidents and obligations.
Describe it. AI builds it.
Tell the AI Designer what you need and it assembles the layout, the charts and the filters in seconds. Then fine-tune it with slicers, calculated fields and your own report theme.
One dashboard, a tab for every area.
Executive view, third-party risk, risk management, internal audit, issues and incidents, assessments, access control, trends and metrics, policies and obligations. Each tab only appears to profiles with access to the matching module.
Ask your data in plain language.
Ask AI answers questions about partners, contracts, risks, incidents and obligations using your real records, with no complex filters or manual reports.
You decide what data is released.
Administrators choose which tables and columns reports can use. Open any report in read-only mode and export it to PDF for the board pack.
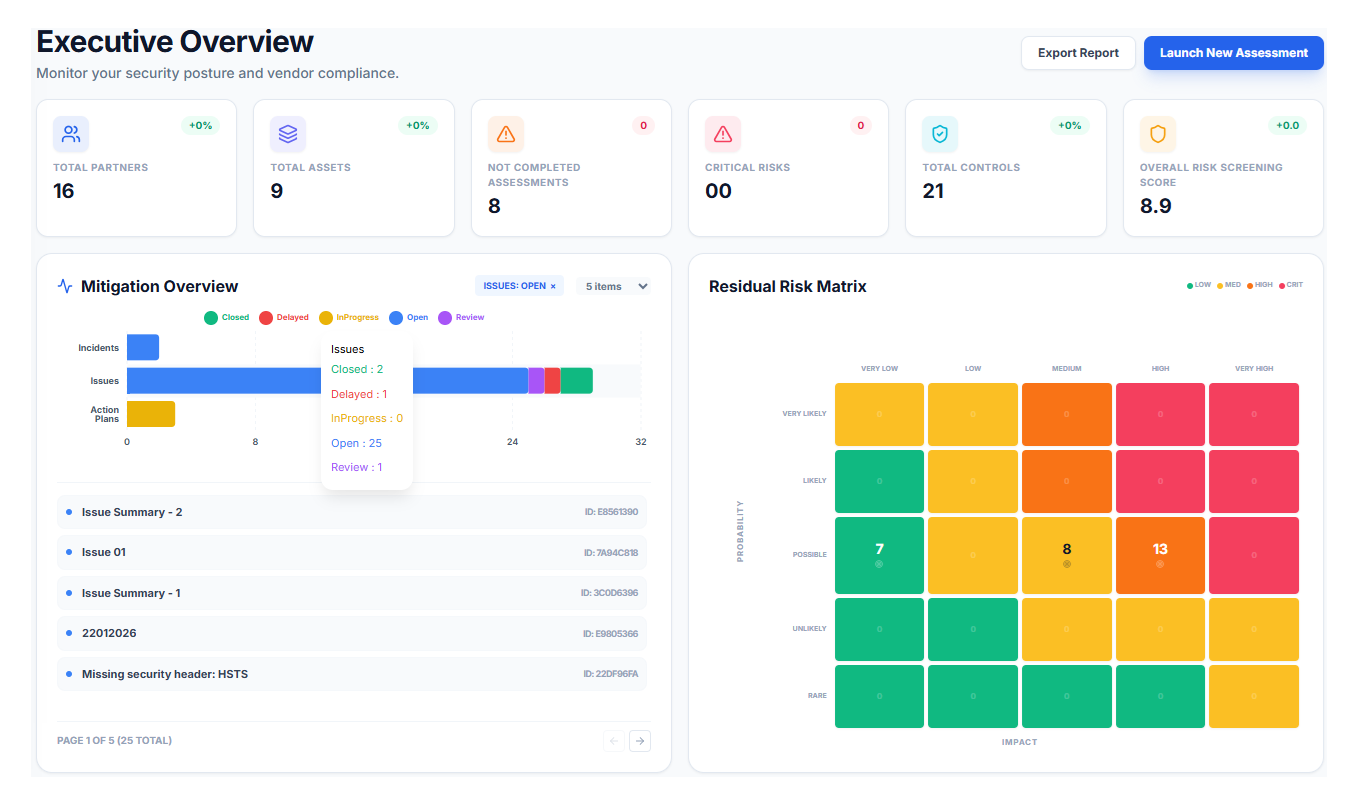
One dashboard, a tab for every area.
The Dashboard consolidates risks, controls and heat maps, with a tab per area. Each tab only appears for profiles with access to the matching module.
Ready to see your risk posture at a glance?
See how KORAGRC turns GRC data into board-ready reporting.